TikTok Shop Category Trends: Build a Category Trend Dashboard

TikTok Shop category trends tell ecommerce teams which product categories are gaining demand, which products are rising inside those categories, and where inventory, pricing, creator content, or market timing may create an opportunity. The mistake is treating “trending products” as a list to copy. A category dashboard should answer sharper questions: is this category growing in the target region, are products still in stock, are creators making enough content, is price pressure increasing, and i
-
1
TikTok Shop category trendsare useful when they connect category rank, product velocity, price, availability, creator content, and region into one decision view. - 2This workflow builds the dashboard around six blocks: category ranking, trending products, stock availability, price bands, creator/video evidence, and weekly action status.
- 3TikTok’s Catalog Insights explicitly supports Trending Products and Trending Categories reports, with rankings from 1 to 50 and CSV exports; third-party tools can add broader product, GMV, or creator signals.
- 4Use [BrowserAct Agent](https://www.browseract.com/agent?co-from=blogbottiktok) to test a prompt-first research run, BrowserAct Workflow to refresh the same category watchlist weekly, and [BrowserAct CLI](https://www.browseract.com/cli?co-from=blogbottiktok) when the approved dataset needs to feed Sheets, BI, or an ecommerce ops stack.
- 5Keep the workflow read-only and evidence-linked. Do not treat private seller data, login-only dashboards, estimated GMV, or scraped public pages as the same source type.
What a TikTok Shop category trend dashboard should answer
A useful dashboard starts with decisions, not widgets.
Business question | Dashboard output |
Which categories are rising this week? | ranked category list, region, source, timestamp, change note |
Which products explain the movement? | product name, price, shop, category, rank, source URL |
Is the opportunity still accessible? | stock signal, availability, number of competing products, saturation note |
Are creators already proving the category? | creator/video count, example videos, hook patterns, engagement signals |
Is the category commercially usable? | price band, margin note, shipping complexity, return-risk note |
What should the team do next? | test product, brief creator, monitor, pause, ignore, or escalate |
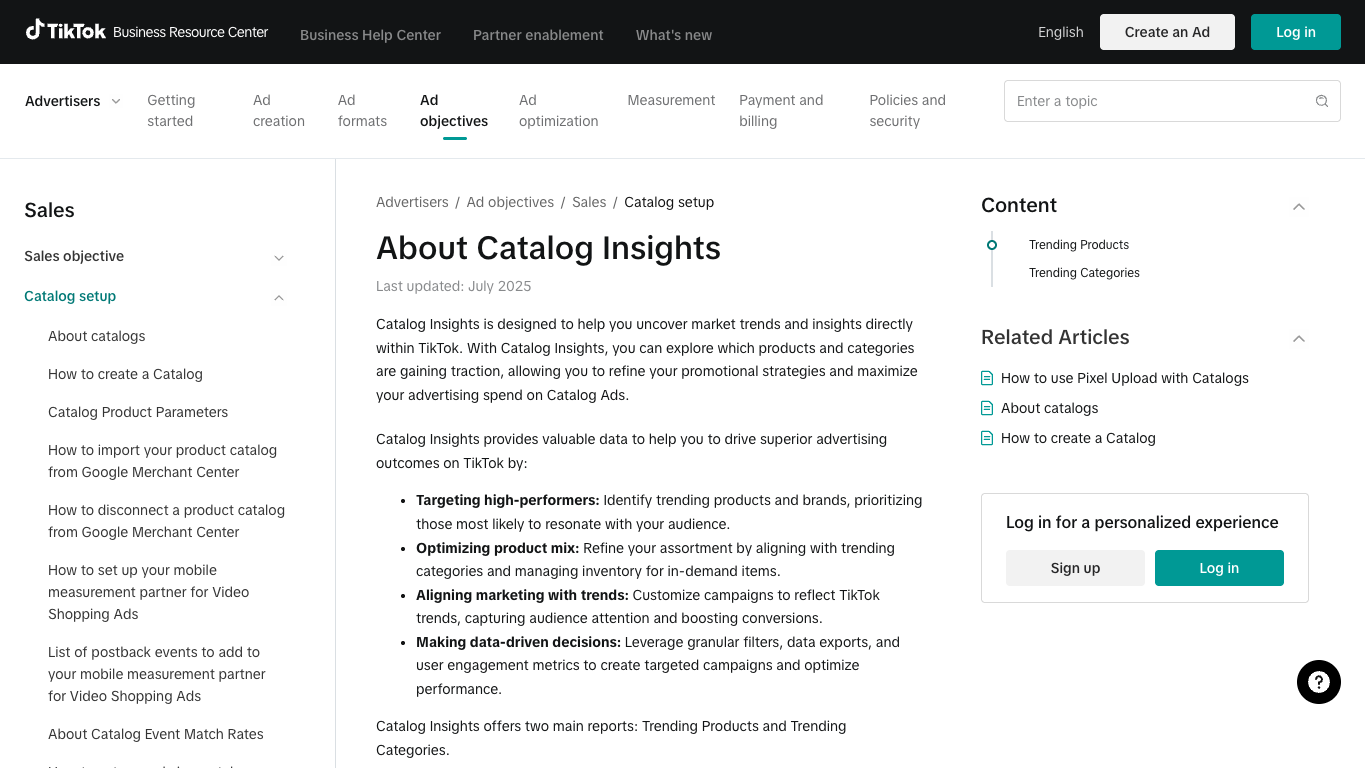
That gives the dashboard its backbone: rank, category, product match, availability, and export. But a team still needs outside context. TikTok’s report can show what is moving in your catalog context; external tools and public pages can show what the broader market is talking about.
The minimum schema
Before collecting pages, define the row format. The dashboard should distinguish official TikTok data, public product research, third-party estimates, and internal notes.
Field | Why it matters |
| official_tiktok, seller_center, public_page, third_party_tool, manual_review |
| keeps every row auditable |
| trends vary by market |
| the category being tracked |
| current rank when visible |
| product driving category movement |
| seller, shop, or brand when visible |
| price and currency when visible |
| in_stock, out_of_stock, unknown |
| related creator videos, ad videos, or content examples |
| engagement, purchase-intent note, ranking, GMV estimate, or platform note |
| short phrase from the source page or product page |
| timestamp for trend freshness |
| watch, test, brief_creator, stock_check, price_review, ignore |
source_type and confidence_note separate. A third-party sales estimate can be useful, but it should not be blended with an official TikTok rank as if both came from the same measurement system.
Which sources belong in the dashboard?
Do not build the dashboard from one source. Use each source for the job it is good at.
Official TikTok signals
TikTok Catalog Insights gives the most direct official structure for a catalog-focused dashboard. It can surface top products and categories, product rank, SKU, brand, price, category, availability, and CSV export.
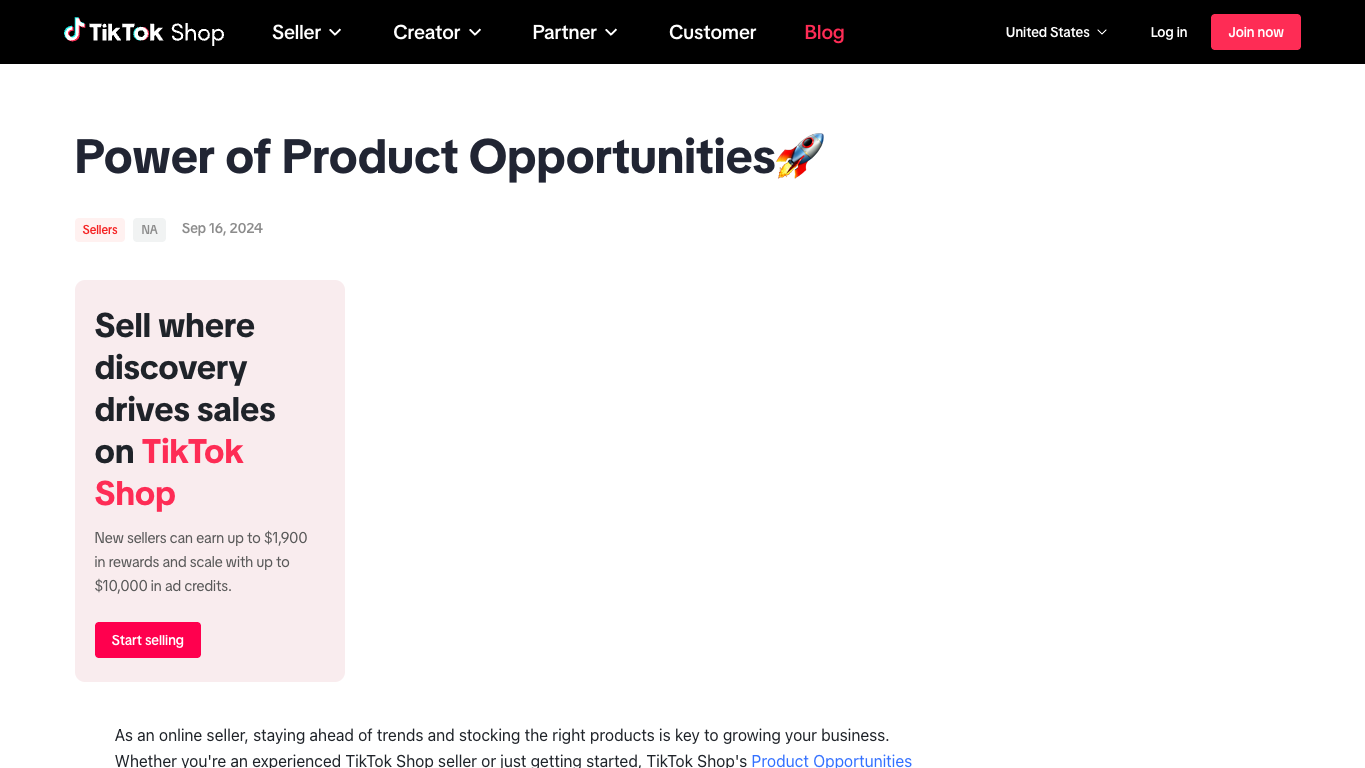
TikTok Shop’s Product Opportunities page also points sellers toward popular keywords, subcategories, and products, which is a strong signal that category trend research is a seller workflow, not just an ad-team curiosity.
TikTok Shop’s own Shop Tab category article is also useful for understanding why categories matter in a shopping surface: shoppers browse products by category, not just by individual viral video.
Public and third-party market context
Darkroom’s TikTok Shop trending-products guide makes a practical point: product trends differ by region and category, so filtering by target market is not optional. It also distinguishes TikTok Creative Center, ad-intelligence tools, and sales-analytics tools.
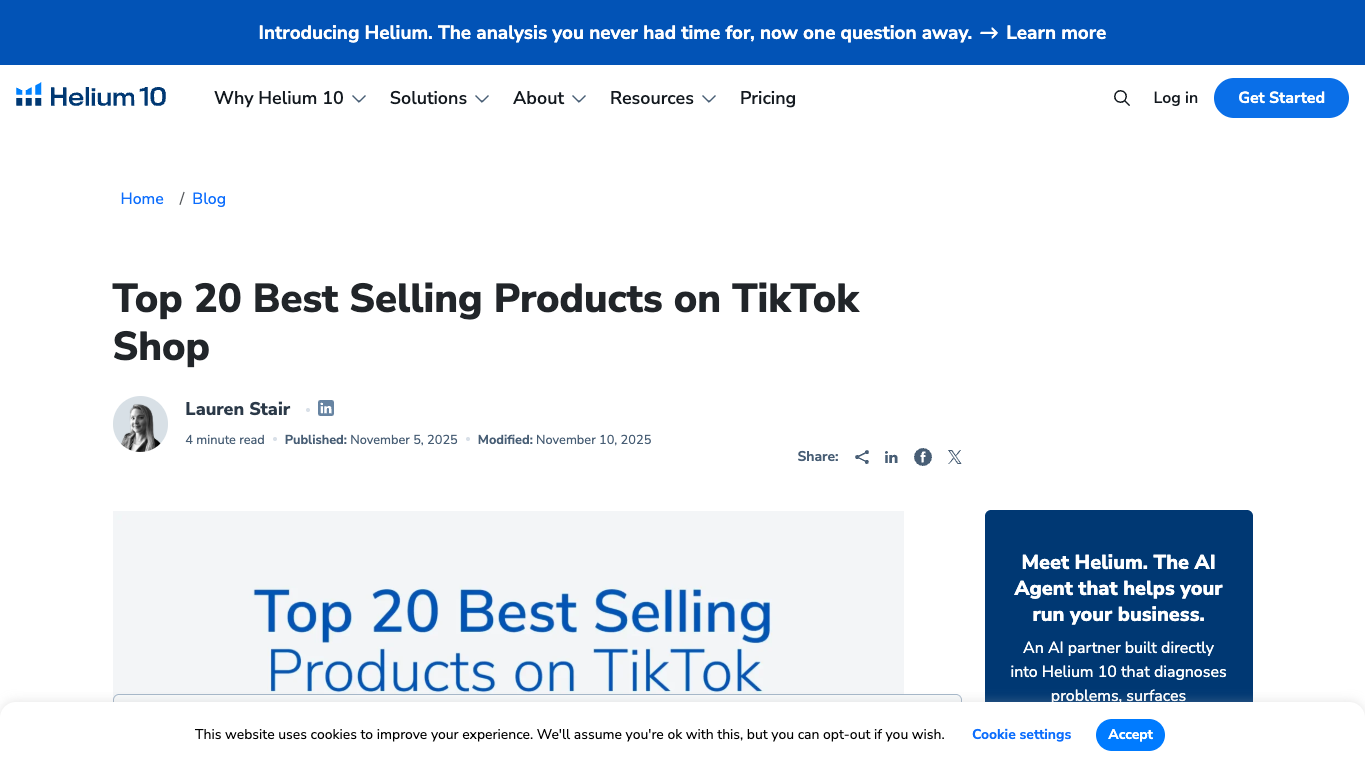
Helium 10’s TikTok Shop product article shows the kind of metrics ecommerce teams look for when evaluating products: GMV, units sold, category, price range, and engagement metrics. Those fields are useful dashboard columns, even when the exact numbers come from a separate tool.
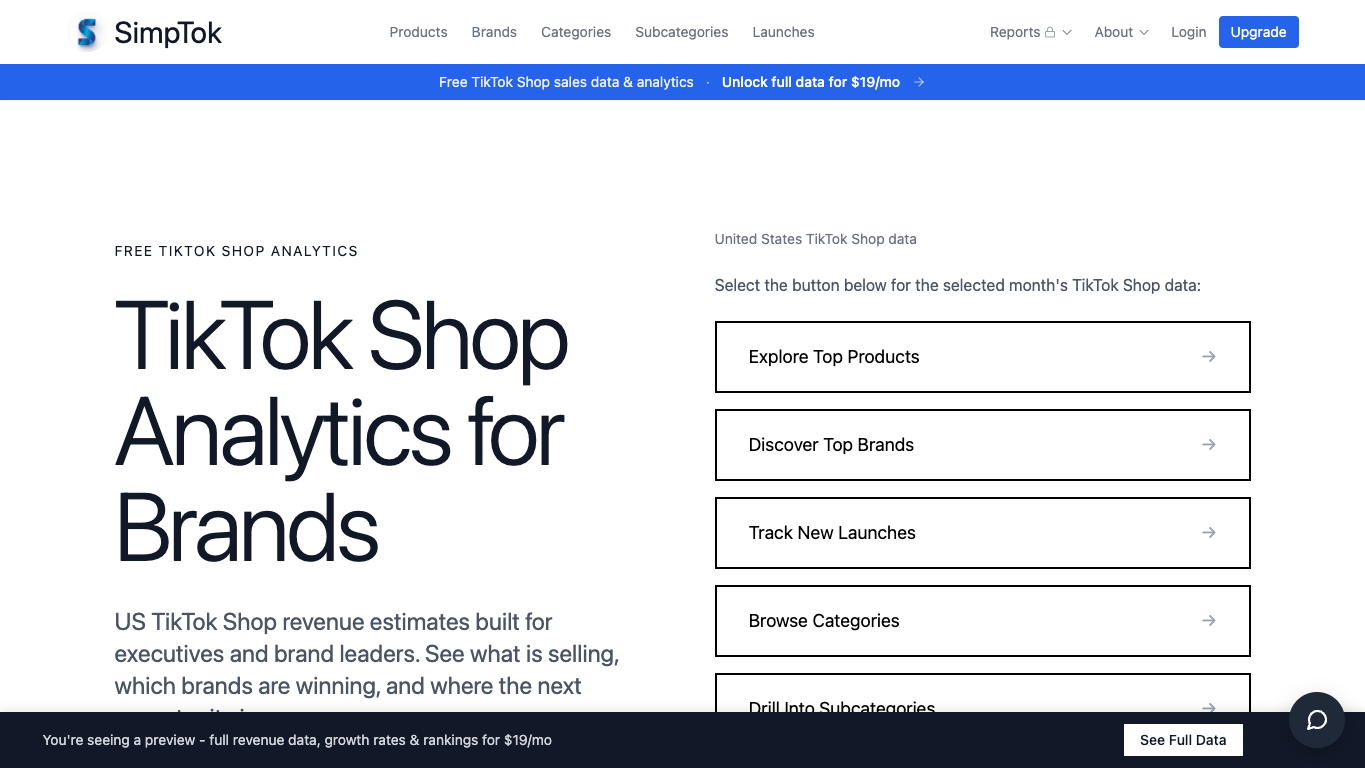
SimpTok is a simpler example of a TikTok Shop analytics surface: top products, top brands, categories, subcategories, launches, and market selection. It is useful as a visual model for the kind of category navigation sellers expect.
Pro Tip: Use third-party tools to widen the view, not to overwrite your source trail. If a tool estimates GMV, record the tool, date, and caveat next to the value.
Dashboard layout: from raw rows to decisions
The dashboard should have three layers.
Layer 1: weekly category watchlist
This is the executive view.
Category | Region | Rank | Direction | Top product signal | Availability | Action |
Beauty tools | US | 3 | rising | creator videos increasing | mixed | test 3 SKUs |
Home organization | US | 8 | stable | high views, crowded sellers | in stock | monitor |
Pet accessories | US | 19 | rising | fewer competing videos | unknown | source check |
Fitness recovery | US | 11 | falling | price pressure rising | in stock | pause ads |
Layer 2: product evidence table
This table keeps the research honest.
Product | Category | Source | Price | Stock | Evidence | Next step |
Product A | Beauty | TikTok Catalog Insights | visible | in stock | rank + category match | add to test list |
Product B | Home | Third-party analytics page | estimated | unknown | rising views | verify seller count |
Product C | Pets | Public product page | visible | unknown | creator demo pattern | find affiliates |
Layer 3: creator and content evidence
Products do not win on TikTok Shop only because the item exists. They win because creators can demonstrate, explain, or dramatize the product.
Signal | What to capture |
creator_count | number of relevant creator/video examples found |
hook_pattern | before/after, problem-solution, demo, comparison, testimonial |
objection | price, trust, shipping, quality, size, safety |
video_angle | educational, impulse, transformation, review, bundle |
content_gap | what competing videos are not explaining |
Build the dashboard with BrowserAct
Use this module when you need BrowserAct to collect public or authorized category and product signals into a weekly TikTok Shop category trend dashboard.
- Open BrowserAct Dashboard
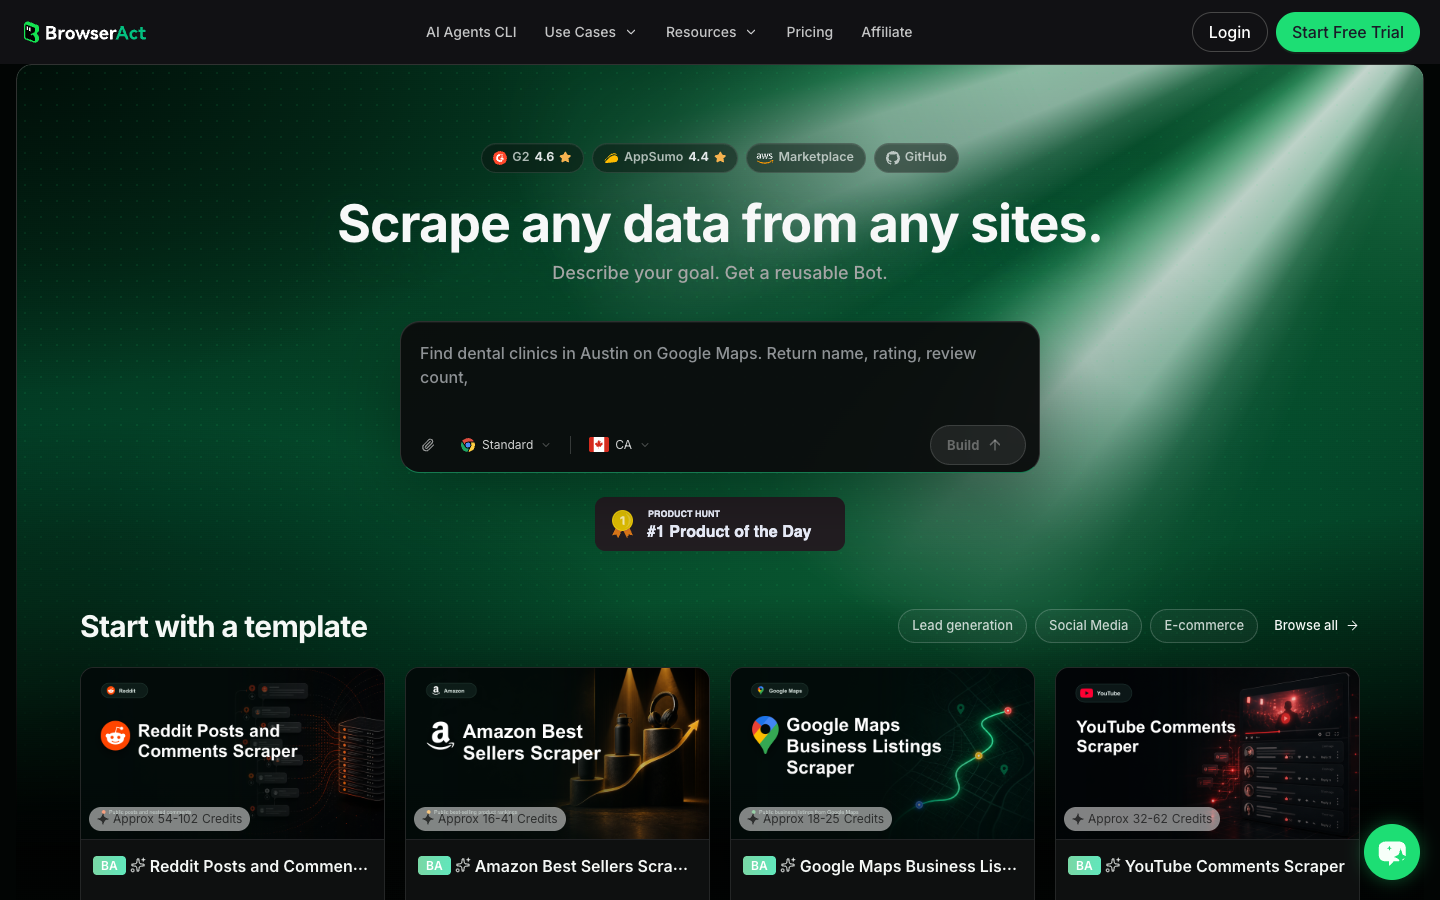
Click the left-side + button to create your own Bot, start from Quick start, or paste the prompt directly into the center Agent input to begin building.
- Copy the complete prompt
Replace the category list, regions, source URLs, and result limit. Keep the stop rules.
Build a TikTok Shop category trend dashboard from public or authorized sources.

Targets:
- TikTok Catalog Insights or TikTok Shop pages the user is authorized to access
- Public TikTok Shop product/category pages supplied by the user
- Approved public third-party research pages such as TikTok Shop analytics, product research, or category trend pages

Regions:
- US by default. Add other target markets only if the source page supports them.

Categories:
- Add the target categories here, such as beauty, home, health, fashion accessories, pets, fitness, or kitchen.

Collect up to 300 rows across the target sources. Do not keep scrolling forever.

For each row, capture:
- source_type: official_tiktok, seller_center, public_page, third_party_tool, manual_review
- source_url
- source_title
- region
- category_name
- category_rank when visible
- product_name when visible
- shop_or_brand when visible
- price and currency when visible
- availability or stock signal when visible
- creator_or_video_signal when visible
- demand_signal: rank, engagement, purchase-intent note, GMV estimate, units sold, or source-provided trend label
- evidence_quote: the shortest exact phrase that explains the signal
- confidence_note: official rank, third-party estimate, visible page evidence, or manual review needed
- collected_at
- action_status: watch, test, brief_creator, stock_check, price_review, ignore

Deduplicate by source_url plus category_name plus product_name when available. If product_name is missing, deduplicate by source_url plus category_name plus evidence_quote.

Stay read-only. Do not create ads, edit catalogs, change stock, message creators, purchase products, submit forms, change account settings, or access private/restricted data.

If login, CAPTCHA, 2FA, account confirmation, seller-only permission, private data, payment, or restricted access appears, pause and record the stop reason instead of continuing automatically.

Export the result as a source-linked table suitable for CSV, JSON, Markdown, or Google Sheets.
Scrape data from any website.
Describe the data you need. Get a Bot — a reliable, reusable scraper.
Prompt preview: collect TikTok Shop category ranks, products, prices, stock signals, creator/video evidence, source URLs, confidence notes, and weekly actions. Private session · Choose your region before you run
Get your Bot — Free- Handle login only when asked
If BrowserAct pauses on login, CAPTCHA, 2FA, seller permission, account confirmation, payment, or restricted data, treat it as a human checkpoint. Do not automate around it.
- Review, dedupe, and export
Inspect rows, remove duplicates, separate official source rows from third-party estimates, and export to CSV, JSON, Markdown, or a Sheets-ready table. Save the approved collection path as BrowserAct Workflow for weekly refreshes. Use BrowserAct CLI when the same dashboard needs to feed BI, Sheets, or ecommerce operations.
No fake live export screenshot is shown here. Until your team runs your actual seller pages, regions, and category list, the honest artifact is the prompt, schema, real Dashboard screenshot, and source-linked dashboard design.
How to score each category
A category trend dashboard needs a simple scoring model. It does not need to be perfect; it needs to be consistent enough to compare categories week over week.
Score component | Example rule |
Demand signal | official rank, product velocity, product views, engagement, or third-party trend label |
Supply gap | trending category but few matching products or stock gaps |
Creator proof | enough creator videos or demo content to validate content fit |
Margin fit | price band and shipping complexity are workable |
Saturation risk | too many lookalike sellers, falling rank, or heavy ad competition |
Evidence quality | official source > authorized seller view > visible public page > third-party estimate |
Score pattern | Suggested action |
high demand + low supply + creator proof | test product or source SKU |
high demand + high saturation | watch and differentiate creative |
low demand + high margin | small test only |
official rank but no creator evidence | brief creators before stocking heavily |
strong third-party estimate but weak source trail | verify with another source |
Weekly operating rhythm
The dashboard should refresh on a cadence that matches the speed of TikTok Shop decisions.
- Monday: refresh category ranks, product examples, and new public signals.
- Tuesday: review stock, pricing, creator evidence, and saturation notes.
- Wednesday: choose test products or creator briefs.
- Friday: mark actions as tested, rejected, or still watching.
This rhythm is where BrowserAct Workflow has the most leverage. The first BrowserAct Agent run helps the team discover the schema. The saved workflow keeps the same collection logic stable. CLI or Sheets handoff lets the operations team consume the result without manually reopening every source.
Common mistakes
Mistake 1: Copying a viral product list
Viral product lists are useful for inspiration, but they rarely explain region, timing, saturation, stock, creator fit, or margin.
Mistake 2: Mixing official ranks and estimates
An official TikTok Catalog Insights row and a third-party GMV estimate should not share the same confidence label. Keep source provenance visible.
Mistake 3: Ignoring category mapping
TikTok notes that category data may use Google Category from the user’s catalog by default, and may be assigned automatically when missing. If your catalog mapping is messy, your dashboard can misread category opportunity.
Mistake 4: Forgetting inventory
TikTok’s own Catalog Insights includes availability and stock status. A hot category is not useful if your matching products are out of stock or too slow to replenish.
Mistake 5: No creator evidence
TikTok Shop is a content-led marketplace. If a category has demand but no obvious video angle, the product may need a creator strategy before inventory investment.
Conclusion
TikTok Shop category trends are most valuable when they become a weekly decision system, not a one-off list of hot products.
Start with official TikTok signals where available. Add third-party and public market context. Keep source type, category, price, availability, creator evidence, and action status in the same table. BrowserAct helps turn that research path into a repeatable, prompt-first workflow; the team still needs to interpret the source quality and decide what to test next.
Further reading: TikTok research
Frequently Asked Questions
What are TikTok Shop category trends?
They are category-level signals showing which product areas are gaining demand, creator attention, stock movement, or purchase intent on TikTok Shop.
What should a TikTok Shop category dashboard include?
Include category rank, region, product examples, price, stock status, source URL, creator/video signal, demand signal, confidence note, and action status.
Can BrowserAct build a TikTok Shop dashboard automatically?
BrowserAct can collect public or authorized source rows into a structured table; teams should still review source quality and seller-only access boundaries.
How often should TikTok Shop category trends be checked?
Weekly is a practical cadence for most teams; fast-moving paid campaigns or inventory decisions may need daily checks.
Are third-party TikTok Shop analytics tools enough?
They can add useful estimates and views, but the safest dashboard keeps official, public, third-party, and manual-review rows clearly separated.


