Social Media Competitor Analysis: A Practical Guide

One competitor publishes constantly. Another posts less often but attracts detailed questions from potential customers. Which strategy should influence your next campaign? Follower totals will not answer that. Useful social media competitor analysis connects comparable observations to a decision. This guide shows how to select competitors, collect defensible data, compare metrics, and turn creative patterns into experiments. BrowserAct can help with a bounded collection task; the analysis still
- 1Social media competitor analysis is most useful when every comparison uses a defined competitor set, platform, time window, and content sample.
- 2Keep numerical benchmarking and creative review together, but do not confuse public engagement with reach, conversions, or ad spend.
- 3BrowserAct fits custom browser-based data collection; specialist analytics products fit packaged benchmarking and recurring reports. Choose by the work you need to repeat.
- 4Preserve source URLs and missing-data states. A blocked profile or capped export cannot support a claim about everything a competitor published.
- 5End the report with a test, an owner, and a measurement plan—not a recommendation to copy the competitor’s most popular post.
What is social media competitor analysis?
Social media competitor analysis is a structured review of other organizations’ social content, positioning, and observable audience response to inform your own strategy. It combines a defined comparison sample with qualitative interpretation: what they publish, how they present it, and which questions or reactions appear around it.
It differs from simply collecting competitor posts. A scraper produces observations. Analysis explains which observations are comparable and what your team should test next. It also differs from continuous social media monitoring, which focuses on detecting changes or signals that need attention.
The workflow problem is real. In a DigitalMarketing community discussion, a marketer described opening competitors’ Instagram and LinkedIn profiles before creating content. They asked whether others used tools, how often they checked, and whether the numbers or the creative mattered more. Those are separate decisions, not one software-shopping question.
The practical answer is to use collection for consistency and human review for interpretation. Neither a spreadsheet nor an AI summary can tell you a competitor’s actual business results from public posts alone.
Start with a decision and a defensible competitor set
Write the decision at the top of the brief. “Choose next month’s product-education topics” produces a different analysis from “Understand a competitor’s launch messaging.” Without that constraint, a research session can expand into a collection of unrelated screenshots.
Separate direct competitors from attention competitors. Direct competitors sell a similar solution to a similar audience. Attention competitors may be publishers, educators, or creators whose content reaches the people you want to help. Include both when useful, but do not rank them as if they have the same business model.
Create a registry with organization name, competitor type, official website, verified social URLs, region or language focus, and the reason it belongs in the comparison. Verify profile identity rather than assuming the first matching handle is official. Regional accounts, employee profiles, distributors, and fan pages should not silently enter the same group.
Competitor type | Why include it? | Useful comparison | Common mistake |
Direct product rival | Competes for similar buyers | Product education, positioning, visible customer questions | Assuming its conversion funnel matches yours |
Adjacent solution | Solves part of the same problem | Alternative framing and use cases | Treating all audience overlap as product competition |
Publisher or creator | Competes for audience attention | Hooks, explanation formats, recurring topics | Comparing its follower base as a sales benchmark |
Regional account | Serves a specific market | Language, local campaigns, response patterns | Combining regional and global accounts without labels |
Pro Tip: Record why an account was included before collecting its best posts. Otherwise popularity can quietly replace relevance as your selection criterion.
Make the sample comparable before calculating anything
Define the platform, date window, post types, and collection method for each comparison. A set of recent videos from one account is not directly comparable with all-time popular image posts from another. Search ranking and pinned posts can also distort what appears first.
Keep a coverage record next to the content sample. It should say whether the intended window was fully inspected, whether the export hit a result cap, and whether access restrictions prevented collection. If the dataset is only “the first accessible posts,” call it that. Do not rename it “all posts in the last month.”
Post age matters. An older post has had more time to accumulate visible reactions. For an ongoing study, choose a consistent observation interval after publication where feasible. If you cannot do that, retain the observation time and avoid treating the raw ranking as a controlled performance test.
Separate sponsored-content evidence from guesses. A visible ad disclosure or an entry in an official ad resource can support a statement about an observed advertisement. High engagement by itself does not establish that a post was boosted, how much was spent, or what the campaign earned.
For platform-specific collection detail, use the Instagram competitor analysis workflow or the Twitter search workflow. Those narrower tasks should feed the shared comparison model, not create a different definition of “performance” for every platform.
Choose metrics you can actually observe
Public research is strongest when it is explicit about unavailable information. You may observe a post’s text, date label, content format, and displayed reaction or comment counts. Availability differs by platform, surface, account, and session. Keep fields null when they are not visible.
Do not infer competitor reach, impressions, saves, click-through rate, conversions, revenue, or audience demographics from a public profile. Those may require account access, licensed data, or separate research. If a tool estimates a metric, label it as an estimate and understand its methodology before using it in a decision.
Measurement | How to define it | What to check | Safe interpretation |
Observed posting frequency | Observed posts divided by the inspected period | Was the period completely covered? | Publishing cadence within this sample |
Visible interactions per post | A declared set of displayed interaction fields | Are the same fields available for every post? | Response within a consistent measurement definition |
Follower-based interaction ratio | Declared interactions divided by the observed follower count | Follower snapshot timing and missing values | A normalization proxy, not reach-based engagement |
Content mix | Posts in a reviewed category divided by classified posts | Consistent categories and an unknown option | How the sampled content is distributed |
Share of observed mentions | Brand mentions divided by all in-scope brand mentions | Equivalent queries, sources, and deduplication | Share within the collected conversation set |
A worked example: normalizing without overclaiming
Consider a teaching example, not a measured campaign. Account A has 20,000 followers and a post with 200 interactions under your chosen definition. Account B has 2,000 followers and a post with 40 comparable interactions. The follower-based ratios are 1% and 2%, respectively.
That does not prove B reached more people, converted better, or has the stronger strategy. A still has more observed interactions on that post. The ratio simply makes one aspect of scale visible. Post age, format, audience composition, promotion, and the quality of the discussion remain possible explanations.
For a multi-post sample, report the typical result and the outliers separately. A median can keep one unusually popular post from dominating the summary, but it does not repair biased sampling. Keep the sample size and collection boundary beside the number.
Pro Tip: Write the numerator and denominator in the column description before using the label “engagement rate.” If two sources define the rate differently, do not combine them under one heading.
Review creative patterns as carefully as the numbers
Use numerical results to choose what deserves a closer look, not to outsource the creative judgment. Inspect the actual post, media, landing destination when relevant, and the visible discussion. A strong reaction count can accompany confusion or criticism.
Build a short annotation guide your reviewers can apply consistently. Useful dimensions include the audience problem, opening hook, format, proof offered, call to action, and observed questions. Keep a distinction between what the post explicitly says and your interpretation of its role in the customer journey.
Sprinklr’s competitor-analysis guide discusses content formats, funnel stages, and testing gaps. Use those as lenses rather than facts about a rival’s internal strategy. A product tutorial may support consideration, but you cannot establish its revenue contribution by looking at the post.
Review dimension | What to record | What to avoid |
Audience problem | The specific task or objection addressed | A generic category such as “valuable content” |
Hook | The actual opening mechanism: question, demonstration, claim | Copying the exact wording as your proposed creative |
Proof | A visible demo, example, source, or customer quotation | Assuming every claim has been validated |
CTA | The action the post requests | Treating a demo link as proof of demo bookings |
Discussion | Recurring visible questions and objections | Calling a few selected comments market consensus |
Gap hypothesis | What your audience may still need | Declaring a topic absent without checking other relevant posts |
Choose tools after you define the research contract
Start with the least complicated approach that preserves the evidence you need. The right tool depends on whether the difficult part is collecting custom fields, producing comparable recurring reports, or interpreting creative details.
BrowserAct for custom, bounded collection
BrowserAct is a fit when your task needs a particular set of visible fields and source URLs rather than a fixed analytics dashboard. Its current interface supports describing a requirement and building a reusable Bot. That can support the collection layer of competitor research, subject to the target’s access limits and a verified extraction result.
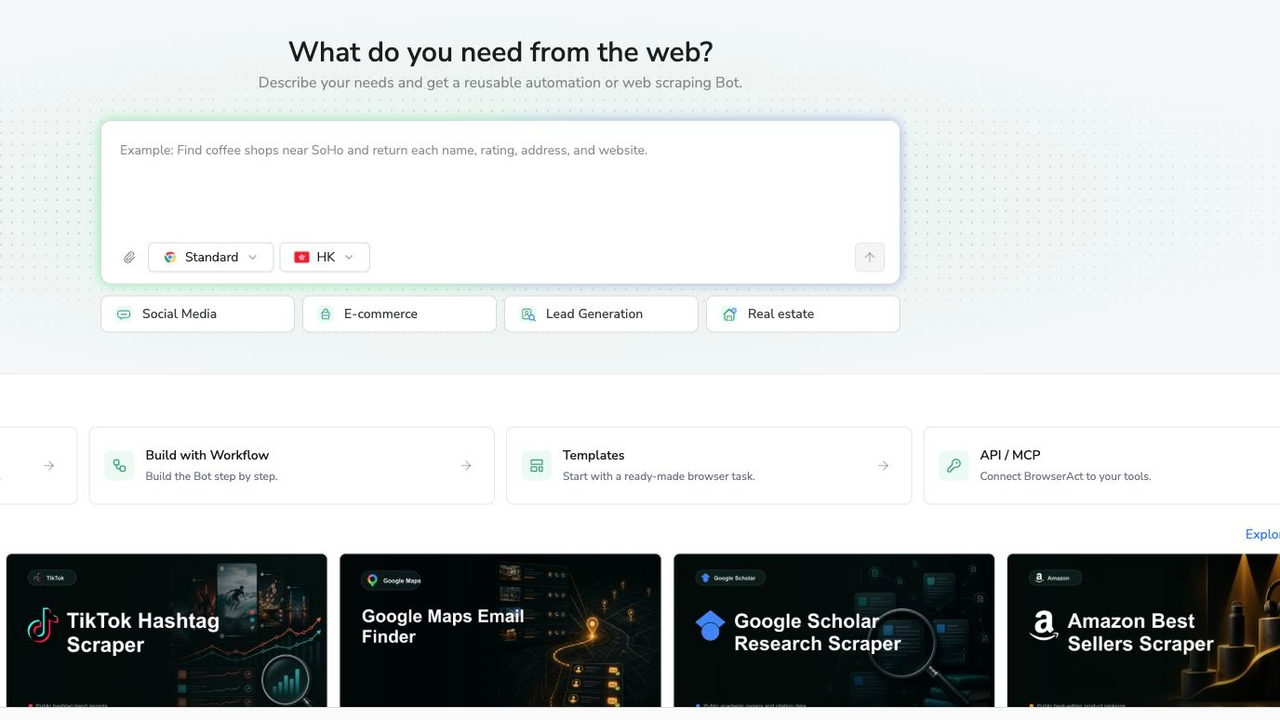
BrowserAct’s actual English creation interface. A requirement defines a collection task; it does not by itself establish complete coverage or analytical accuracy.
The main trade-off is ownership of the research process. Your team still defines the sample, checks records, calculates comparable metrics, and interprets results. BrowserAct should not be presented as automatically revealing a competitor’s private analytics or ad budget.
Before adopting recurring collection, run a small acceptance test and inspect both an accessible result and a failure case. Our separate Facebook access pilot stopped at a login prompt and returned no post records. That is a reason to preserve source-health status, not a reason to fill the competitor’s metrics with zeros.
Specialist analytics for recurring benchmarking
Rival IQ’s official product site describes competitive analysis, social-post analysis, audits, alerts, and reports. A packaged analytics product can be a better fit when you want a maintained comparison interface and repeatable reporting rather than custom extraction logic.
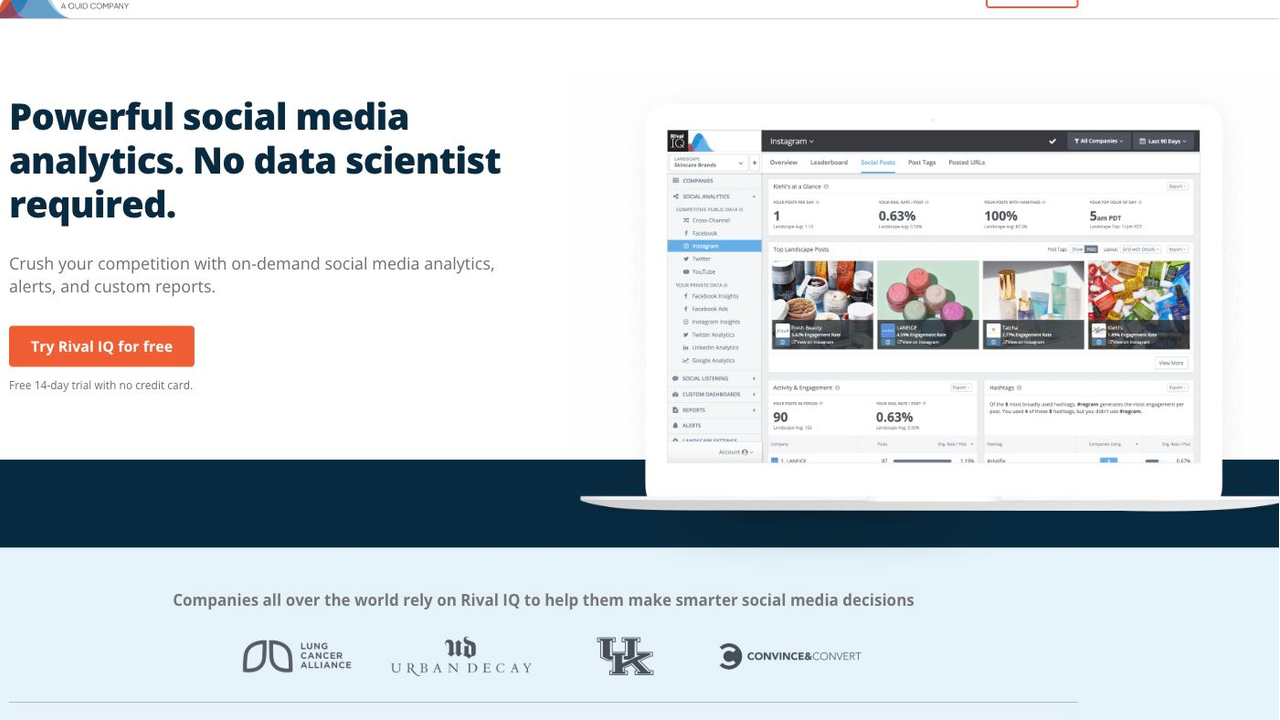
Official Rival IQ product-page screenshot, checked September 8, 2026. The example dashboard belongs to the vendor; it is not our test dataset or an independent benchmark.
Validate the exact networks, historical coverage, export limits, metric definitions, and account requirements for the plan you are considering. A channel logo on a website does not tell you that every post type and metric is available for every competitor.
Manual review for the creative and contextual work
Manual inspection remains useful for a small competitor set, especially when the question concerns hooks, explanation quality, or a confusing discussion. Its weakness is consistency: people can favor memorable posts, miss older material, or record different fields each time.
Use a fixed review template and keep source links. Manual research becomes much easier to audit when the next reviewer can reproduce the observation without asking what you meant by “this one worked.”
Approach | Best fit | Main strength | Main limitation | Cost to evaluate |
BrowserAct | Custom visible-field collection | Flexible task definition and inspectable output | Access and extraction need validation; analysis remains separate | Build/run consumption plus review and maintenance |
Specialist analytics | Repeated competitor benchmarking | Packaged comparisons, reporting, and supported integrations | Plan-specific sources and metric definitions | Subscription, account limits, history, and exports |
Manual research | Small samples and creative interpretation | Direct contextual review | Time and reviewer consistency | Staff effort and refresh frequency |
Use a report that separates evidence from interpretation
Keep three layers in the workbook. The source layer contains the account registry, observations, URLs, timestamps, and access states. The comparison layer contains the stated metric definitions and calculations. The decision layer contains the findings, supporting records, limitations, and proposed tests.
Those layers can live on one sheet for a small project. The important distinction is ownership: a hypothesis should not be copied back into the source data as if it were an observed fact.
A compact decision row can contain the following fields:
- Finding: the specific pattern you observed.
- Evidence: links to the relevant source records and the sample definition.
- Limitation: missing sources, ambiguous categories, or alternative explanations.
- Test: one change your team can make to its own content.
- Owner and review date: who will act and when the result will be evaluated.
- Success measure: a metric your own authorized analytics can actually measure.
For example, an observed cluster of repeated setup questions can justify testing a more explicit onboarding tutorial. Measure the performance of your own tutorial against an appropriate baseline. Do not describe its future success as established by the competitor research.
Pro Tip: Keep “observation,” “interpretation,” and “recommendation” in separate columns. That small separation makes weak leaps in reasoning much easier to catch.
Refresh the analysis on a cadence your team can use
Tie the refresh schedule to planning. A quick recurring review can identify new announcements, while a deeper periodic review can compare content patterns. Choose the actual interval around your publication cadence, source volume, and available review time rather than treating daily collection as automatically better.
Preserve the competitor set and definitions across periods. If you add an account, change a query, or lose access to a platform, annotate the change. A jump in observed mention volume might reflect improved collection rather than a shift in market attention.
Use AI to propose content labels or summarize already collected records, but keep the evidence accessible and allow an unknown category. Require source IDs for important claims. Do not let a summary invent motivations, audience demographics, or commercial outcomes to make the report sound complete.
The end of each review should be a decision: run a test, keep the current approach, or gather a specific missing piece of evidence. More rows are not the objective.
Turn competitor research into your next experiment
Good social media competitor analysis makes your own choices clearer. Define a comparable sample, respect missing data, inspect the creative, and make one testable recommendation. You do not need to know a competitor’s private numbers to learn from its public communication.
If custom collection is the bottleneck, start with a small BrowserAct task and use the monitoring workflow to establish source checks first. Build confidence in the records before putting them in a ranking.
Frequently Asked Questions
How do you do social media competitor analysis?
Define the decision, verify a relevant competitor set, collect comparable samples, calculate clearly defined metrics, review creative patterns, and turn the evidence into a test for your own content.
Which metrics should I compare?
Start with observable posting cadence, consistently defined interactions, content mix, and recurring audience questions. Keep platform, time window, post age, and missing fields visible beside the comparison.
Can I see a competitor’s reach or conversions?
Do not infer them from public posts. These metrics may require authorized account access or another documented data source. Label estimates clearly and do not treat them as observed facts.
Can I do competitor analysis for free?
A small manual review can use public sources and a spreadsheet. Tool trials may help, but verify current limits and include review time when comparing the total cost of a recurring workflow.
How often should I update the report?
Match the cadence to your planning cycle and the pace of relevant changes. Keep a consistent sample and annotate changes in access, competitor selection, or metric definitions between periods.
How does BrowserAct fit competitor research?
BrowserAct can support custom browser-based collection of visible data. Validate each target, retain source URLs and access states, and handle benchmarking and interpretation as separate, reviewed steps.


