LeoLabs Office Locations: Headquarters and Radar Sites

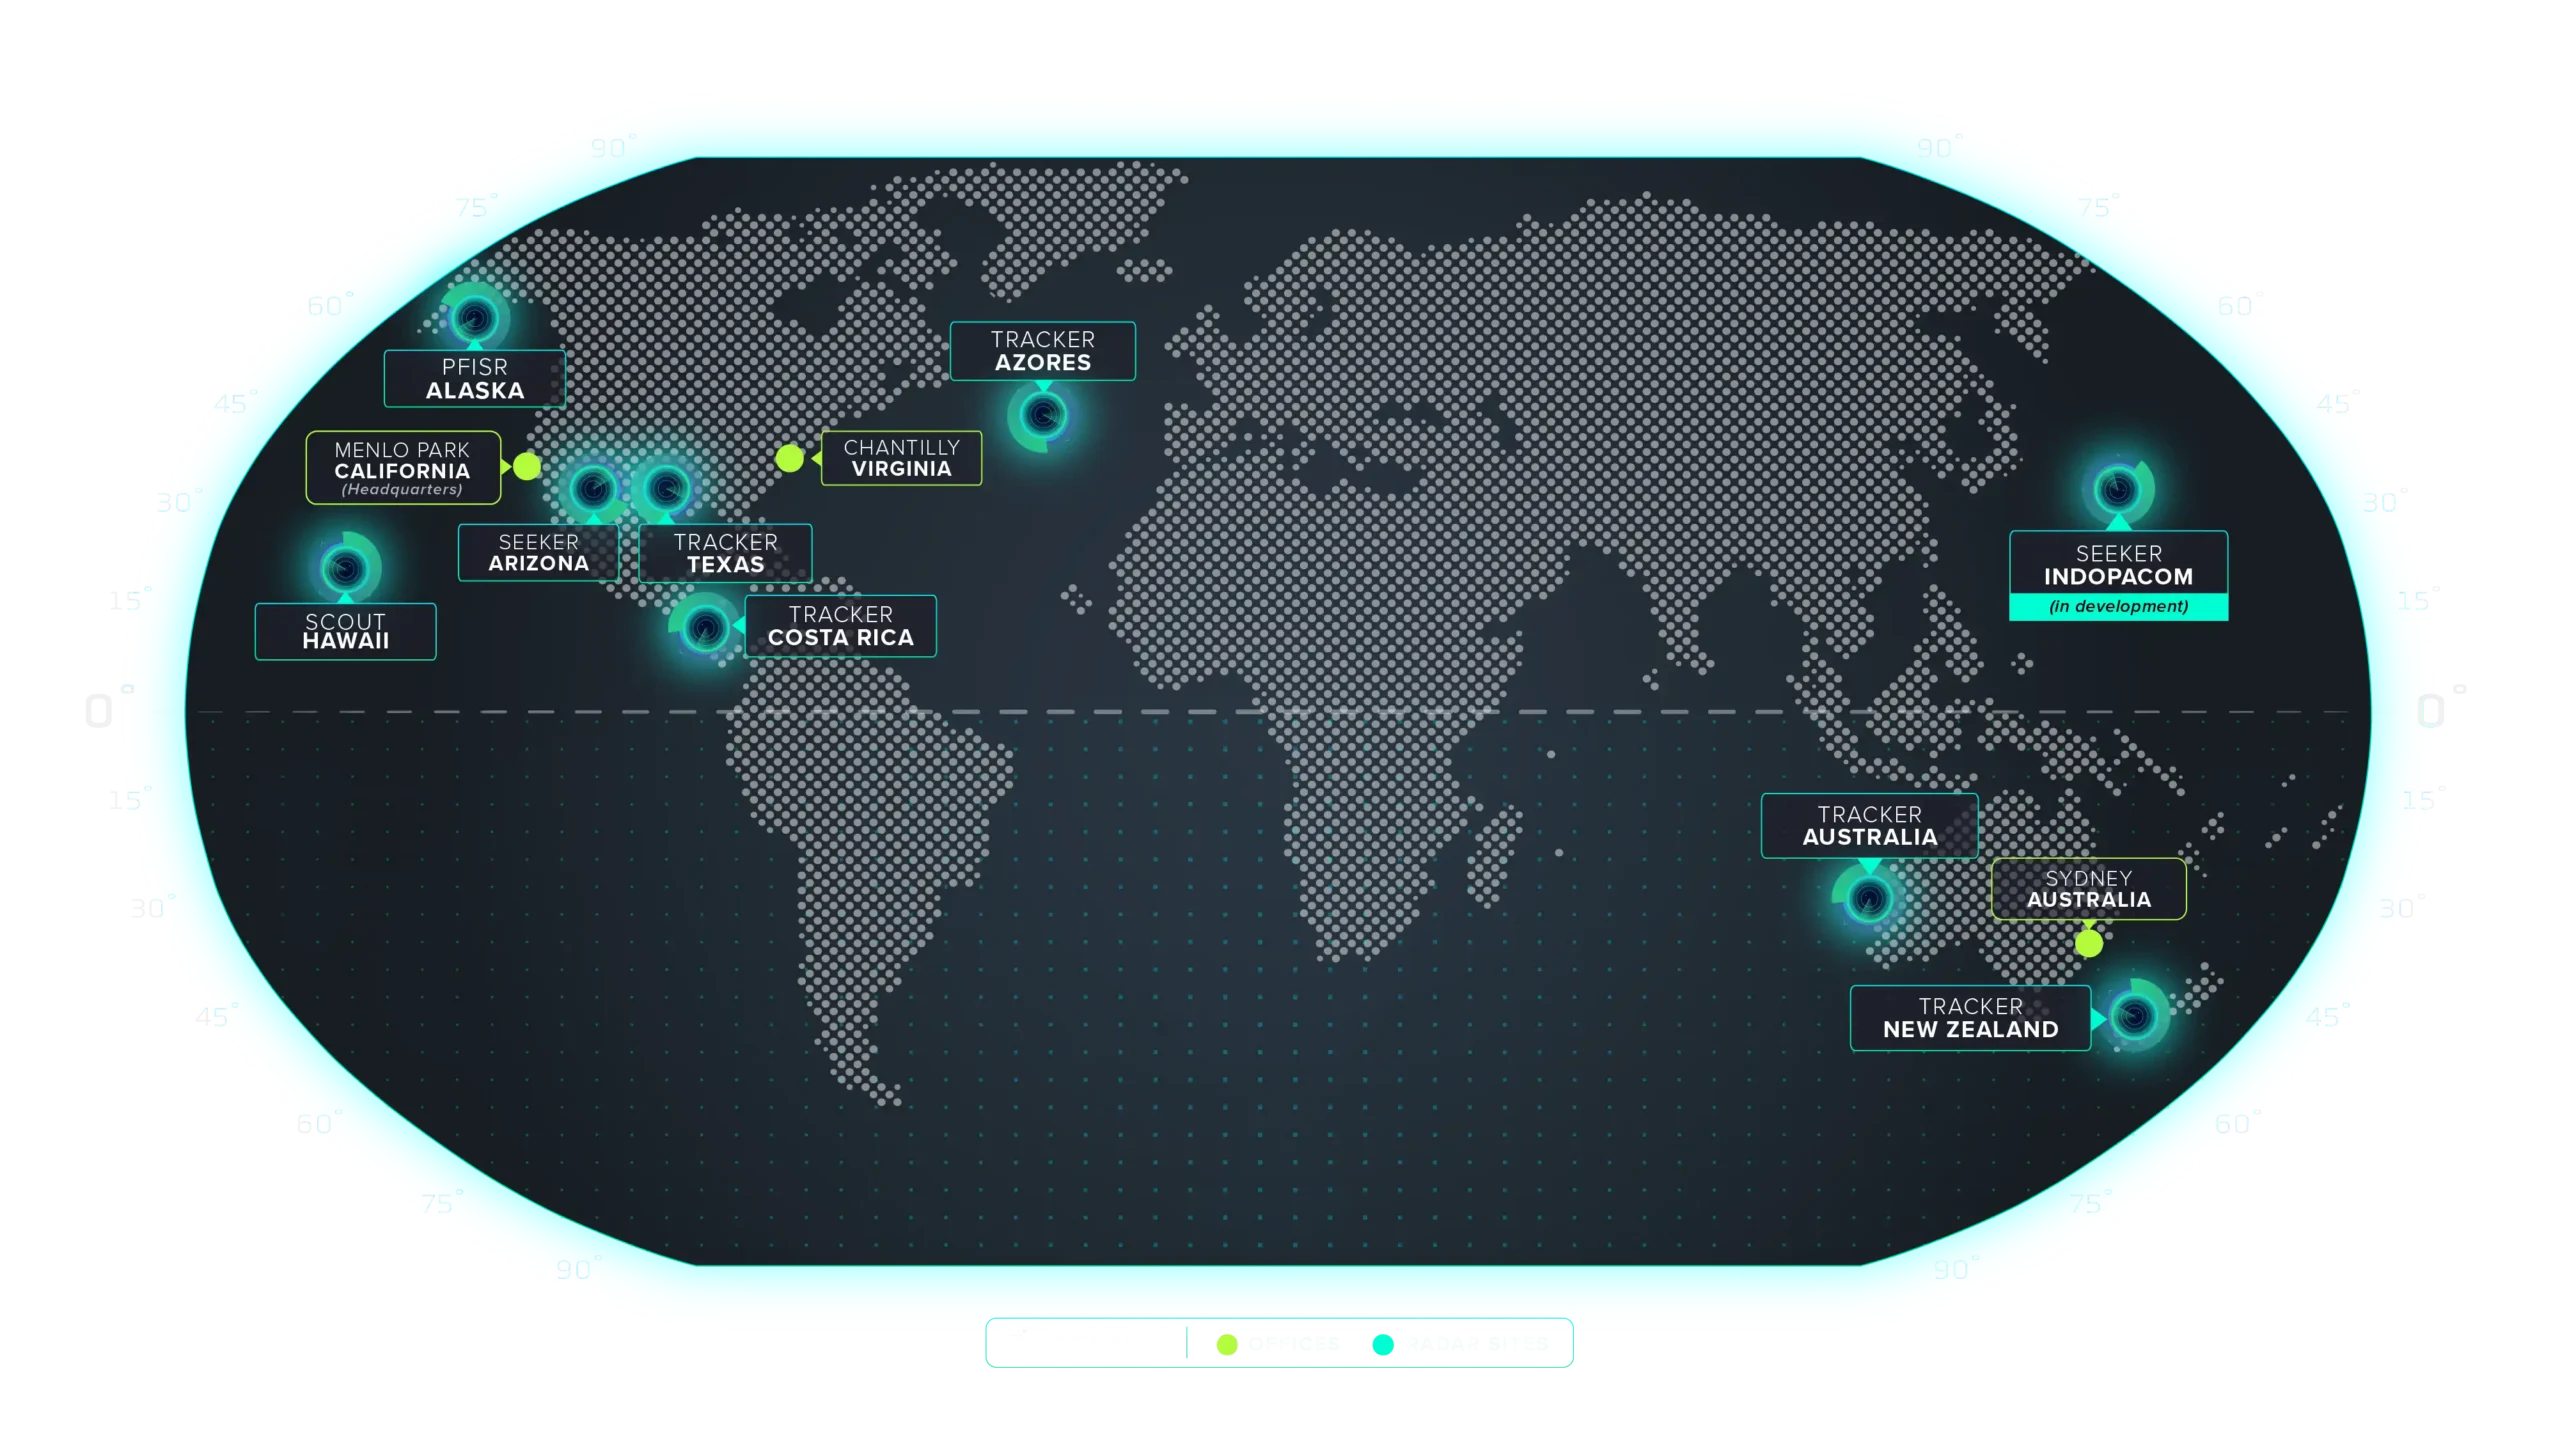
LeoLabs’ official global-presence map identifies Menlo Park, California as headquarters, with offices in Chantilly, Virginia and Sydney, Australia. It also displays a separate network of radar-site markers. The offices and radar sites should be counted and researched separately.
Verified October 7, 2026. Three office records and nine radar markers from the official map, including one radar explicitly labeled in development. The map does not publish street addresses.
Where are LeoLabs’ offices?
The official About page provides a global-presence map with distinct office and radar categories. Its three office markers are Menlo Park, Chantilly and Sydney. Menlo Park carries the headquarters designation.
A map marker establishes a location at the level displayed. It does not establish a street number, visitor entrance or appointment policy. Those fields remain blank in the workbook.
| City | Region | Country | Type |
|---|---|---|---|
| Menlo Park | California | United States | Headquarters |
| Chantilly | Virginia | United States | Office |
| Sydney | New South Wales | Australia | Office |
Read the official presence map by category
The map below is the original company-published graphic. Its office markers and radar markers represent different parts of the business footprint. Combining them into one office total would misrepresent the source.
The asset filename indicates June 2026, while this guide records when the image was checked. That month is retained as asset context rather than converted into an exact publication day or a date when every site became operational.
Radar markers are not additional offices
The official map includes the following radar labels. One Seeker marker is explicitly in development. The absence of that label on another marker is not, by itself, a complete operational-status verification.
| Radar label | Location label | Status shown |
|---|---|---|
| PFISR | Alaska | Shown on official map; operational status not specified |
| Seeker | Arizona | Shown on official map; operational status not specified |
| Tracker | Texas | Shown on official map; operational status not specified |
| Tracker | Costa Rica | Shown on official map; operational status not specified |
| Tracker | Azores | Shown on official map; operational status not specified |
| Tracker | Australia | Shown on official map; operational status not specified |
| Tracker | New Zealand | Shown on official map; operational status not specified |
| Scout | Hawaii | Shown on official map; operational status not specified |
| Seeker | INDOPACOM | In development |
Keep regional labels at their original precision
Some radar entries use broad regions. The workbook preserves labels such as Alaska, Azores and INDOPACOM rather than guessing precise addresses or coordinates. INDOPACOM is not converted into a disclosed country.
The same discipline matters when using a map for company research. An office-city list, a radar-network view and a property-level directory answer different questions. This download supports the first two at the precision available in the source.
Use separate worksheets for office and radar research
The Offices sheet supports questions about headquarters and company workplaces. The Radar Sites sheet preserves the network labels and stated development status. Each row points back to the official map.
When refreshing the research, compare category labels and status changes before adding new rows. A newly added radar marker should update the radar sheet without changing the office count.
Download the LeoLabs research spreadsheet
Three office records and nine radar markers from the official map, including one radar explicitly labeled in development. The map does not publish street addresses. Each record contains its official source, date information and verification date. Empty fields represent information not established in the reviewed source.
Download LeoLabs research Excel
Keep LeoLabs research up to date with BrowserAct
Use the official pages as the starting point for a custom Bot. The prompt below specifies the fields and category boundaries so you can review a source-linked table before incorporating it into your research.
Use Agent Built for a custom source and field list. A relevant BrowserAct template can provide a starting point when its target and output match your task. The cloud Bot is the main workflow here; CLI access is optional for developers connecting their own Agent.
- 1Open BrowserAct Dashboard
Click the left-side + to create a Bot, choose Build with Agent or an available Quick start entry, or paste your request into the center Agent input.
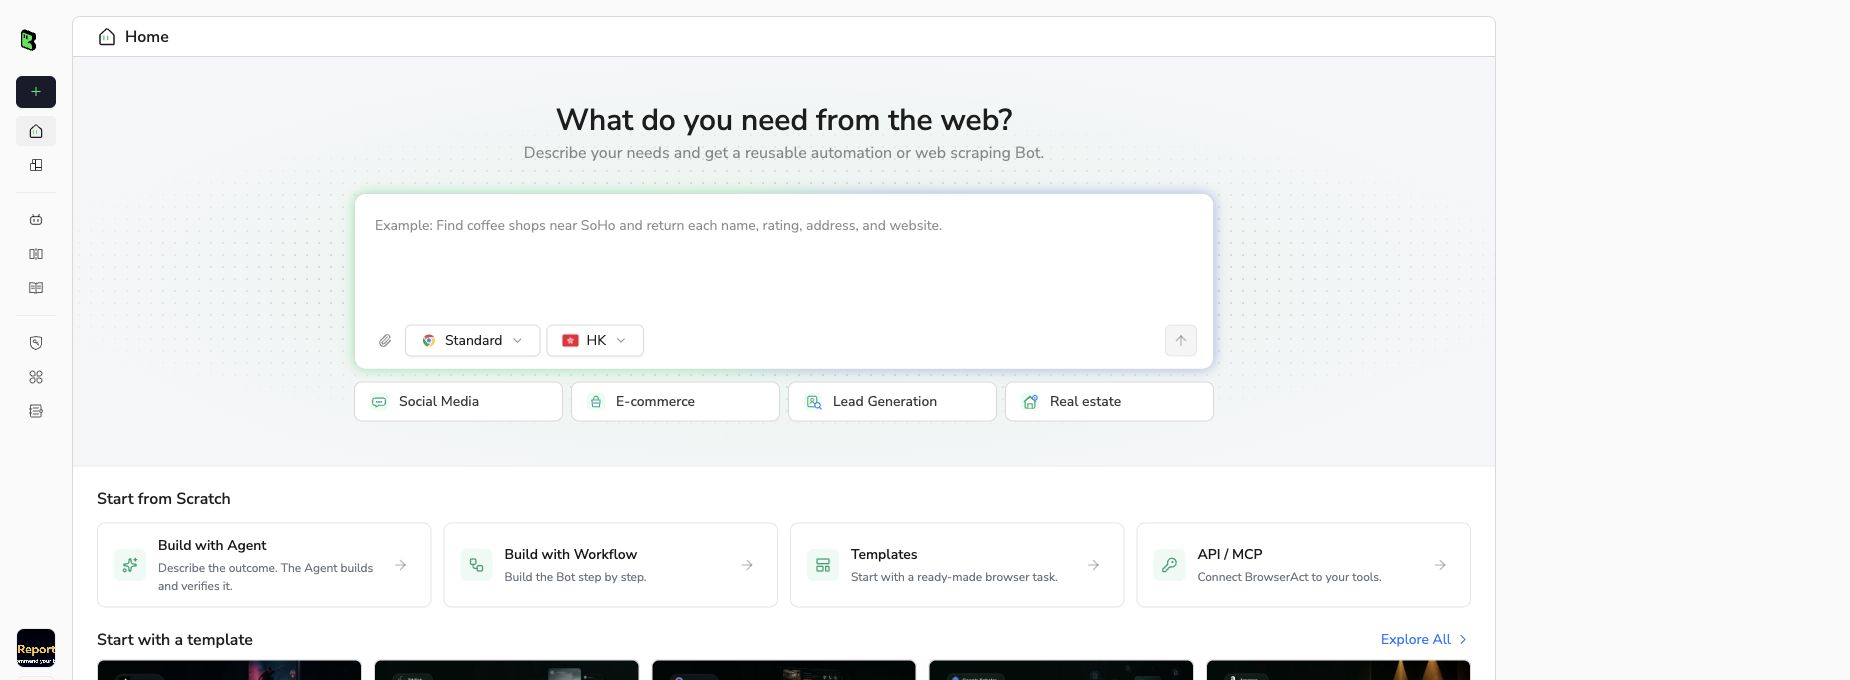
BrowserAct Bot creation screen, captured September 10, 2026. Interface labels may change.
- 2Copy the complete prompt
Review the exact target, result limit, and fields before running the Bot.
Scrape data from any website.
Describe the data you need. Get a Bot — a reliable, reusable scraper.
- 3Handle login only when asked
If the site requests login, CAPTCHA, 2FA or account confirmation, pause and complete the required step manually. Do not bypass restricted access.
- 4Review, dedupe, and export
Compare each row with its source, remove duplicates, and keep missing fields blank. Export CSV or JSON, then open the data in Excel or Google Sheets. Review changes before replacing your previous snapshot.
FAQ
Where is LeoLabs headquartered?
The official map identifies Menlo Park, California as headquarters.
Which other offices are on the map?
Chantilly, Virginia and Sydney, Australia.
How many offices are shown?
Three office markers, including headquarters. This is the count on the reviewed official map.
Are radar sites counted as offices?
No. The workbook keeps nine radar markers in a separate sheet.
Are all the radar markers confirmed operational?
This guide does not establish that. One is expressly labeled in development; the map does not provide a complete status record for every site.
Does the map provide street addresses?
No. The workbook preserves city or regional labels without inventing street numbers.


